

Turn Data into Decisions — Empower Quality with Insightful Analytics. –VirsaFeed
Modern QMS dashboards serve as more than just a monitoring tool: they unify data and provide actionable insights across all major quality processes, driving continuous improvement and regulatory compliance. Below are ways an analytical dashboard supports the critical elements of an effective QMS:
- Change Management:
Interactive dashboards enable real-time tracking of all changes to processes, documents, materials, or systems. Visual timelines, approval status indicators, and automated alerts help prevent unauthorized changes and ensure stakeholders are always informed. Centralizing change data improves traceability and speeds up change review cycles. - Deviations:
Dashboards consolidate deviation reports, showing frequency, root causes, and corrective action status. Heatmaps and trend analyses allow quality teams to quickly identify recurring issues and monitor in-progress or overdue investigations, facilitating faster resolution and learning. - Corrective and Preventive Actions (CAPA):
Advanced dashboards track the lifecycle of each CAPA—from initiation and root cause analysis to effectiveness checks—using graphical process flows. Metrics like open vs. closed CAPAs, resolution times, and recurring issues provide insight into overall system responsiveness and process reliability. - Risk Management:
AI-powered dashboards aggregate risk assessments from multiple sources (audit findings, deviations, supplier scores) and use visual scoring methods, such as risk matrices, to highlight high-priority risks. Predictive analytics forecast risk trends, supporting proactive mitigation strategies. - Audits:
Auditing modules present scheduled, ongoing, and past audits on interactive calendars and Gantt charts. Findings, non-conformities, and audit follow-up actions are visually tracked to ensure timely closure and compliance with quality standards. - Customer Relationship Management (CRM):
By integrating CRM data, dashboards display customer complaints, feedback trends, and satisfaction ratings alongside operational quality metrics. This connection enables traceability from customer issues to process improvements, reinforcing a customer-centric quality culture. - Training:
Dashboards offer transparency into training compliance, certification expiries, and skill gaps. Visual reports highlight overdue or upcoming training for team members, ensuring workforce competency and readiness for quality-critical tasks.
How an Analytical Dashboard Drives Excellence Across QMS Elements
- Centralized Oversight:
Consolidates information from all QMS modules, eliminating data silos. - Real-Time Data & Alerts:
Stakeholders receive live updates for rapid issue response. - Data-Driven Culture:
Empowers organizations to base decisions and improvements on factual, comprehensive data, not guesswork. - Continuous Improvement:
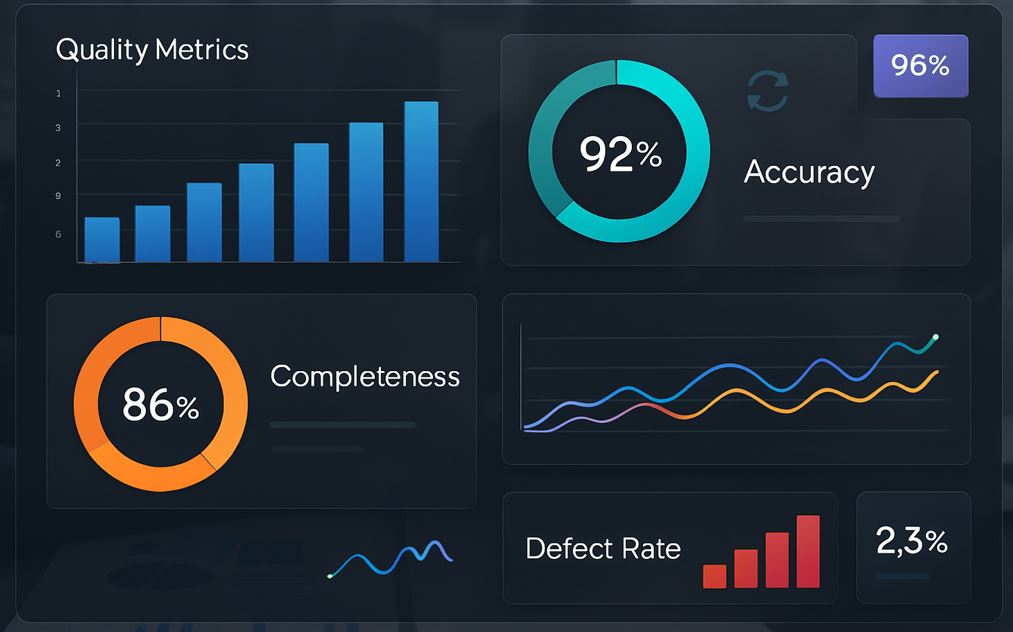
Visualizes KPIs, non-conformance rates, and process effectiveness over time, making it easier to identify positive trends or areas requiring intervention.
Best Practices for a QMS-Driven Dashboard
- Map dashboard sections to each QMS function (e.g., dedicated widgets for CAPA, change management, risk).
- Employ drill-down capabilities to move from summary trends to detailed records (root causes, action logs).
- Integrate AI/machine learning where possible for predictive risk scoring and anomaly detection.
- Ensure dashboards are adaptable for regulatory standards (e.g., FDA, ISO), supporting compliance monitoring.
In summary, a robust analytical dashboard tailored for QMS needs does not simply report on quality metrics but becomes the operative backbone of quality management itself. By providing integrated, interactive, and AI-powered visualizations for all major QMS functions—including change management, deviations, CAPA, risk, audits, CRM, and training—organizations can ensure holistic oversight, rapid responsiveness, and a culture of continuous quality improvement.
Know the Author
Hey there, readers! Welcome to my little corner of the internet. I ain’t just your average blogger — I’m a seasoned project manager with a knack for diving deep into research and unraveling the mysteries of project management. But that’s not all there is to me! With a background in Healthcare, IT and Pharmaceuticals for Project management, hospital management and a passion for travel, hiking, and trekking, I’m all about blending the professional with the adventurous. So, join me on this voyage where we’ll explore the ins and outs of strategy, project management and share tales from the management, travels, and maybe even swap tips along the way.
Feel free to visit my site to know more about my researched output in the form of blogs: http://www.virsafeed.com/
Would you like to connect with me? Please drop me an email at virsafeed.com@gmail.com